
Previously we ran through three showcases – the first discussed how we can help visualise and maintain the changing landscapes required to support regulatory change (Time travelling through the ever changing IT Landscape); the second discussed how we can enrich this time-based view with targeted analytics (Application of Analytics to Kineograph Landscapes). The last showcase included two methods for component layout on the Kineograph Canvas: the first being a hierarchical method in which components are placed within groups and groups within sections (the flow of groups, sections and components going from left to right and from top to bottom); the second approach letting components follow a user defined path with a beginning and end point. In the latter method, the user has full control over how the components are displayed.
In this week’s showcase we will discuss filtering of the view on-screen to focus on key angles.
Filtering
In Kineograph we understand a user may want to view the landscape based on different criteria. With this in mind we have created 3 flexible methods for filtering the displayed components:
- Tags
- Numerical output from Perspectives
- RAG (Red/Amber/Green) status
(Note, further methods will be added over time)
In Kineograph filtering changes visibility of components without having an impact on the Perspective outcomes (for an explanation of Perspectives please see our showcase Application of Analytics to Kineograph Landscapes). If a component does not fulfil the filter criteria it is hidden from the canvas. The three attributes for filtering will be further explained below.
Tag filter
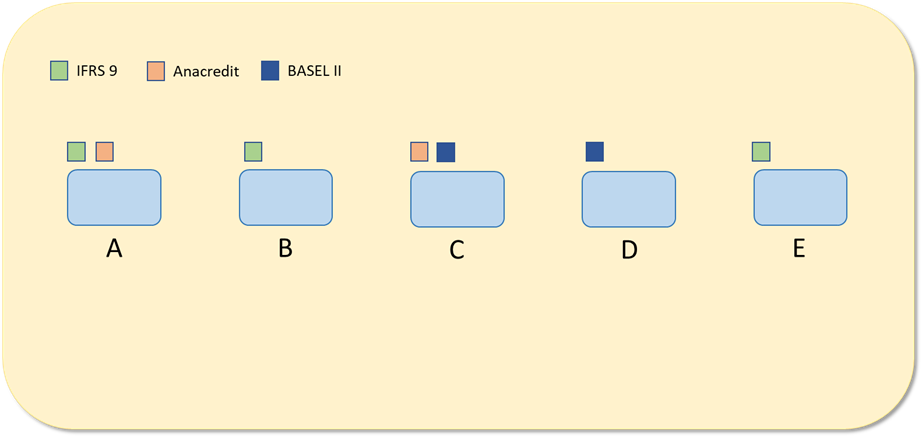
A Tag consists of a colour and a label and is shown as a coloured square above the component. Kineograph can use Tags for filtering components. Generally, the user creates a list of Tags that is related to the components on the canvas. A list of Tags can be for example, IFRS9, Anacredit, Basel II, etc. (see Figure 1 below). This could be useful if the canvas represents an IT landscape of a large financial institution. Each item from the Tag list can be linked to any component on the canvas. Also, multiple Tags can be linked to a single component. When the user applies a Tag filter Kineograph will show the canvas with only the components that are linked to one or more of the topics selected in the topic filter.
Normally the user will set Tags manually. Tags however, can also be set automatically based on input metrics using Perspectives.
Filtering based on numerical output from Perspectives
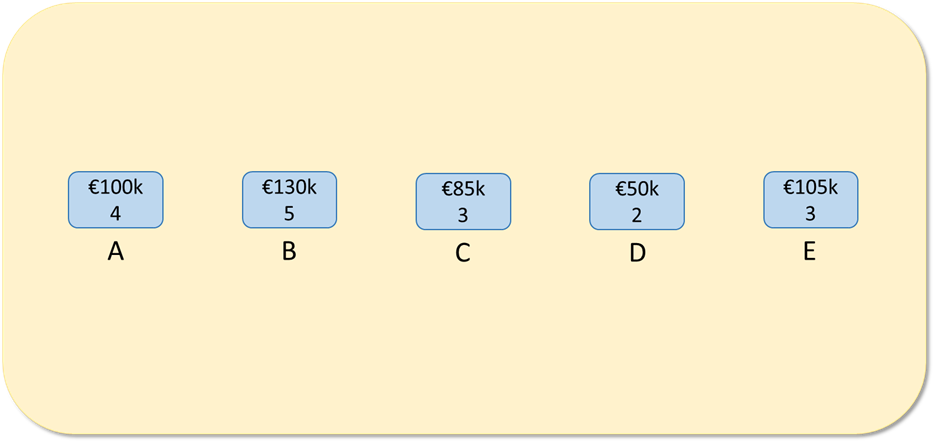
Perspectives allow the metrics shared by components to be used in a filter – e.g. budget, FTE headcount. As has been shown in Application of Analytics to Kineograph Landscapes, the user can choose to display the numerical output from Perspectives inside the component. If the user sets a filter range for the numerical output Kineograph will subsequently only show those components for which the output falls within the filter range. See figure 2 for an example of a canvas having two perspectives: total budget and total FTE.
Filtering based on RAG Status
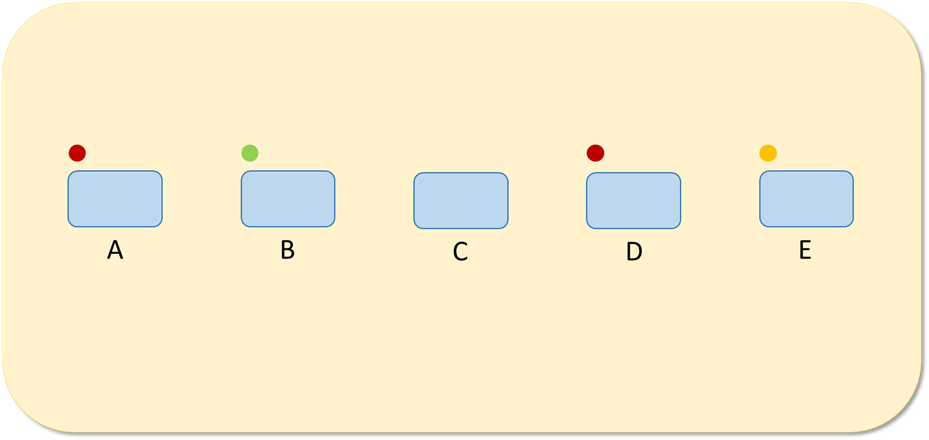
Each component can have a RAG (Red/Amber/Green) status. The status will show up as a coloured circle next to the component on the canvas. RAG Status is an attribute of a component that can be set manually by the user or automatically by a Perspective due to change of an input metric. The user can apply a RAG Status filter to only show components with a Red, Amber or Green status (see Figure 3).
Reference Date
According to our first showcase on Kineograph changing the reference date of a canvas is referred to as time-travelling the canvas. After applying a new reference date to the canvas, Kineograph will only show those components that exist at that reference date. Therefore, reference date seems to act as a filter. It is however not a filter as a filter only impacts the visibility of components on the canvas whereas the reference date can impact perspectives as well.
Layout of components when filtering
The layout of components is not changed when applying a filter in Kineograph. The components follow the same layout logic (i.e. hierarchical or following a path) when the user applies a filter. Of course, the number of visible components on the canvas can differ as Kineograph will only show components that fulfil the filter criteria.
This concludes our last showcase in a series of four showcases explaining the basic features of Kineograph. With Kineograph we aim to provide a flexible, data-driven engine that can visualise the underlying changes a regulatory change programme must undertake in order to achieve compliance – and we want to do this with the ease, immediacy and low-learning time of our favourite applications.
If you have any questions about Kineograph, or are interested in adapting it to your use-case, don’t hesitate to reach out to the team at ACT!
Back to News & Events