
In last week’s showcase we discussed the need to add performance analytics to our architectural landscapes; and we presented a method for doing this. In this week’s showcase we would like to talk to you about organising and structuring complex IT landscapes.
The IT landscape of financial organizations generally contain dozens of IT assets. To support strategy and planning, the landscape is normally modelled in the form of logical views of IT assets (note: in this context IT assets can be applications but also systems).
While some organisations use dedicated tooling such as ArchiMate and Sparx to map out their architecture, many financial organisations use pragmatic, simpler tooling (e.g. MS PowerPoint or MS Visio). While this leverages their existing applications and has the advantage of zero learning curves, it has unfortunate downsides. Whenever the organization deploys a new IT system the designer needs to manually maintain / recreate their overviews. For simple architectural landscapes this is an easy task and wouldn’t require a lot of remodelling of the canvas if, at all. However, when there are dozens of IT assets, the canvas can become quite complex, and 90% of the effort is spent on simply the presentation of the material. Consider a schematic unstructured example of an architectural landscape depicted in the figure below.
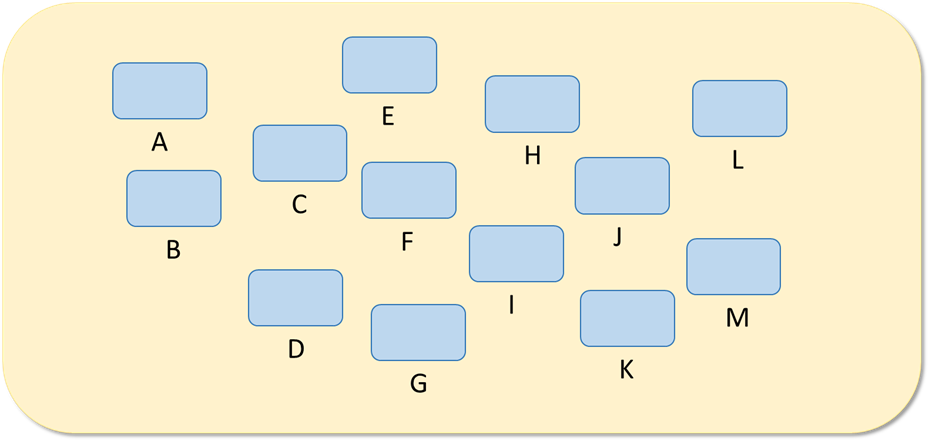
It’s a fact that architectural landscapes change over time, and this exacerbates the above issue. Deployment of new systems or decommissioning of legacy systems due to regulatory change require constant reflection in the visualisations. If the change only involves the edge of the canvas the impact is likely limited. But what if the designer needs to add an IT asset close to the centre, say, next to IT asset F? In the worst case, the designer needs to relocate all assets on the canvas. Needless to say this requires a lot of effort for adding just one additional IT asset.
Using Kineograph to generate IT Landscapes
For this reason (for more reasons read also our first showcase ) ACT developed in-house the web-based tool Kineograph. An important design principle of Kineograph is that the designer does not have control over the exact position of IT assets on the canvas. The designer chooses the structure of the architectural landscape (being sections, groups or alongside paths) but Kineograph determines the position of the IT assets. In essence we want to retain the benefits of tools such as Powerpoint and Excel (with their minimal learning curves and instant results) while also adding in more intelligence and interactivity.
In Kineograph the position of an IT asset (hereafter in this text referred to as component as the application of Kineograph goes beyond IT) depends on the following attributes:
- The order of the component within a group
- The group the component belongs to
- The section the group belongs to
- The path the component belongs to
Note, the path attribute has precedence over the group and section attributes. If a path is set for layout, Kineograph will layout the component according to that path. If no path is set Kineograph will use the group/section attributes for layout.
Group and Section Layout
Section, group and component follow a hierarchical structure. A group has section as parent. A component has group a parent. Just as a component has an order within the group, a group has an order within a section. Also, sections being the highest level within the hierarchy have an order. Thus, the full hierarchy structure including order determine the position of each component.
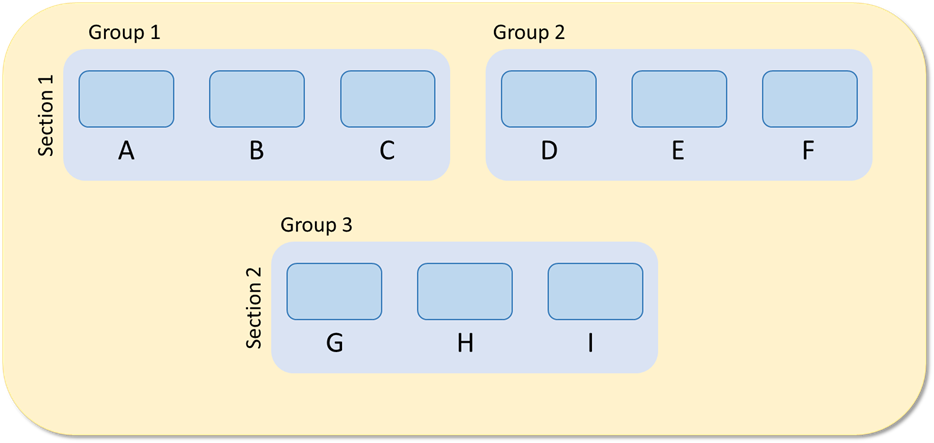
See figure 2 below for an example of a canvas containing a hierarchy and order of nine components, three groups and two sections
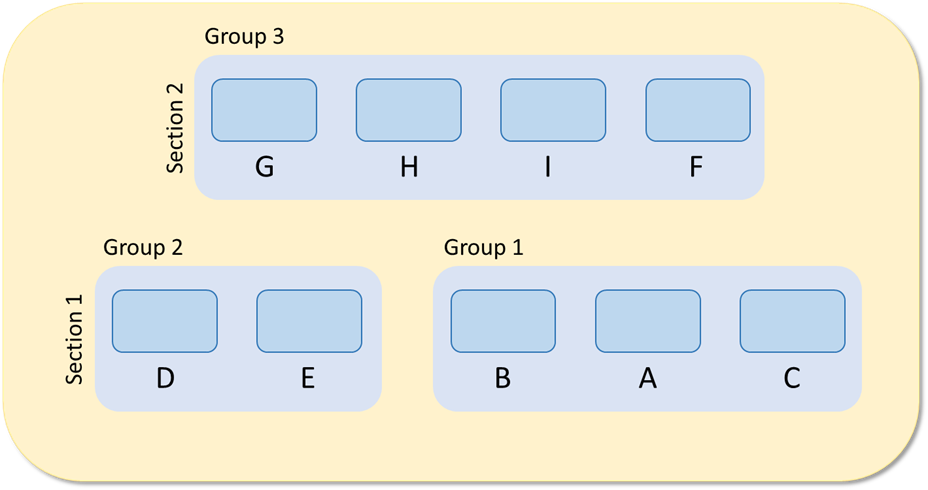
The setup of a hierarchical structure and order provides a flexible way for laying out sections, groups and components on the canvas. This can be seen in the figure below which is the result of the following changes applied to the canvas shown in the figure above:
- The order of component A and B has changed
- The order of Group 1 and 2 have changed
- The order of Section 1 and 2 have changed
- The hierarchical structure of component F has changed
Note that the components in the example of figure 1 are not aligned. The placement on the canvas seems to be somewhat random. In Kineograph the space between components, groups and sections is fixed which leads to automatic alignment and a ‘clean’ canvas such as shown in figure 1 and 2.
Layout along a path
In some cases the group and section layout is not flexible enough and the user may want to layout components in different way than a component positioning from left to right and from top to bottom. To accommodate for those cases Kineograph has the ability to layout components along a path. The user creates one or multiple paths and the first component (depending on order) is placed on the starting point of the path. The next component is placed next to it but also on the path, etc.
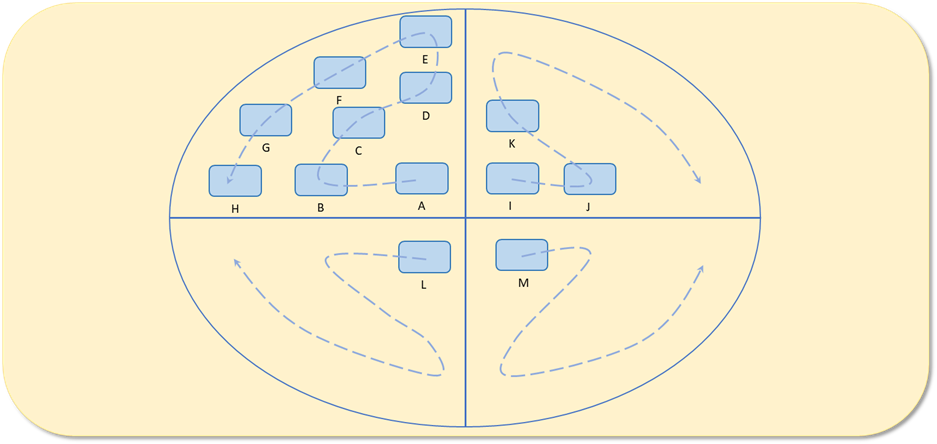
See figure 4 below for an example that uses this type of layout. This layout template has a visible circle divided in four sections and four paths (normally invisible) which start from the centre of a circle stretching out to the edge.
Note, that in the previous showcase we explained that Kineograph is data-driven. The actual visibility and look of components also depends on data fed into the component through other dependent components for both types of layout.
Next Showcase
Kineograph is a tool to design and layout complex IT landscapes. The strength of tool is that the designer does not have to position any of components on the canvas. The tool does this for you. The designer only defines the structure in terms of sections, groups, paths and components. The benefit of this shows especially in case of large canvasses with many components. One important feature that we still haven’t discussed is filtering of components. We will write about this in next week’s showcase!
Back to News & Events