
In last week’s Kineograph showcase we discussed our approach regarding time-travelling through changing landscapes. We explained that change managers generally tend to use MS PowerPoint and MS Visio for modelling landscapes and we showed some of the benefits of using Kineograph over/alongside these tools. In this week’s showcase we would like to start bringing the basic overview to a richer level with the addition of analytics to the Kineograph landscapes.
Context
Given the planning of a change (system, data, process, organisation etc), one may ask the following questions:
- What is the minimal duration of the change?
- If the development of the change is at risk, which other changes are impacted?
- What is the impact on total cost if the financial performance of one component changes?
To answer these questions Kineograph has three concepts that will be explained in this showcase. The concepts are:
- Dependencies;
- Metrics; and
- Perspectives.
We will construct an example from a regulatory IT perspective (related to the first question above) in Kineograph to explain these three concepts.
Setting up the landscape
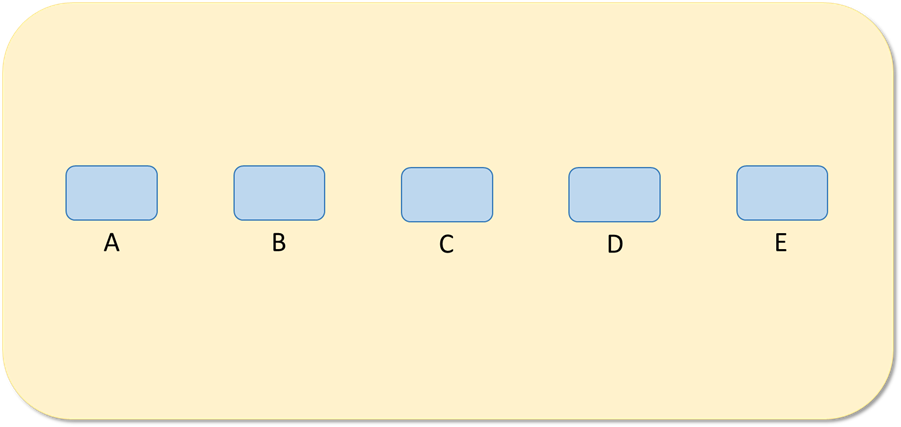
The IT landscape of financial organisations is in a constant flux. As new regulations come into force organisations need to fulfil requirements stipulated by those regulations. To support the strategy and planning for this change, organisations usually model a landscapes in the form of a logical view of applications. To make this clear, consider for example the planning of the development of a new set of applications due to an upcoming new regulation. To become compliant the organisation has to develop five new interrelated applications labelled A till E. For that, we might create a canvas in Kineograph shown below.
Dependency structure of applications
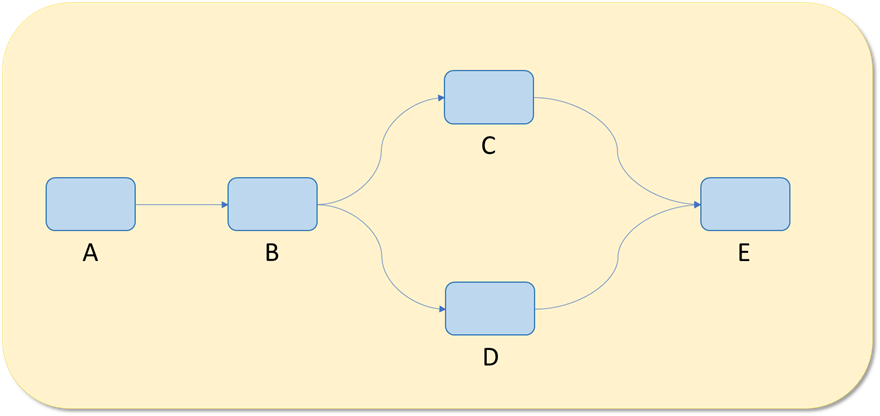
Realistically, application development activities depend on each other. Meaning the development of one application may be started only after the development of another has completed. We extend our example with the dependencies below:
- Development of application B can only be started after the completion of Application A;
- Development of application C can only be started after the completion of Application B;
- Development of application D can only be started after the completion of Application B;
- Development of application C and D may be done in parallel; and
- Development of application E can only be started after the completion of both Application C and D.
In Kineograph, the user builds a dependency structure using drag and drop functionality of the web browser. The user simply drops application A on the top of application B to create a new dependency between the two applications. After having applied the above dependency structure, our canvas has the following logical structure:
You can’t manage what you can’t measure: Introducing Metrics
The canvas above provides helpful visual information about dependencies in itself. A dependency structure, however, is especially useful when metrics are linked to each component. Consider the use case where we want to calculate the minimum time required to develop the full set of applications.
The table below contains the development time to complete the applications:
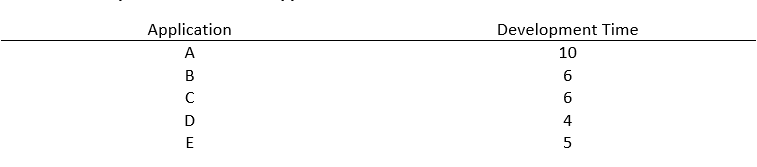
To add the data above to our canvas we need to create metrics. In Kineograph metrics are placeholders to store data of a component. Each component can have metrics in Kineograph. The way the metrics are loaded with data however depends on the type of component, and is limited only by the metrics the user wishes to apply.
In our example we need to create five components with metrics as we have five data points. Note that the development time of application of B and C are the same. We therefore may choose to only create four components with metrics. The actual decision to create four or five additional components depends reason why both development times are the same. We consider this question out of scope for this showcase.
In addition to adding components with metrics to the canvas, the user can link these components to the applications. This can be done using regular dependencies. Figure 3 below shows our canvas after having added the five yellow components with metrics including five dependencies.

Having added metrics and dependencies to our canvas is great, but becomes especially useful in combination with the next part of the puzzle to our canvas: Perspectives. This Kineograph concept is explained further below.
Kineograph Perspectives
Quantitative (and other) information about components is manifested to the user in Kineograph by a concept called perspectives. A perspective is a combination of:
- An operation applied to one or more input metrics; and
- A way of visualizing the output of that operation.
A perspective is applied to the whole canvas and to put it more simply, perspectives are user-friendly representations which reshape the Kineograph canvas to focus on the view the user most needs
For our use case we use the Sum-perspective. This perspective sums the input metrics (following reverse dependencies links) and shows the output in the component. The output itself is also a metric linked to the component that performed the operation. Using the Sum-perspective applied to the development time data we would get the output below.
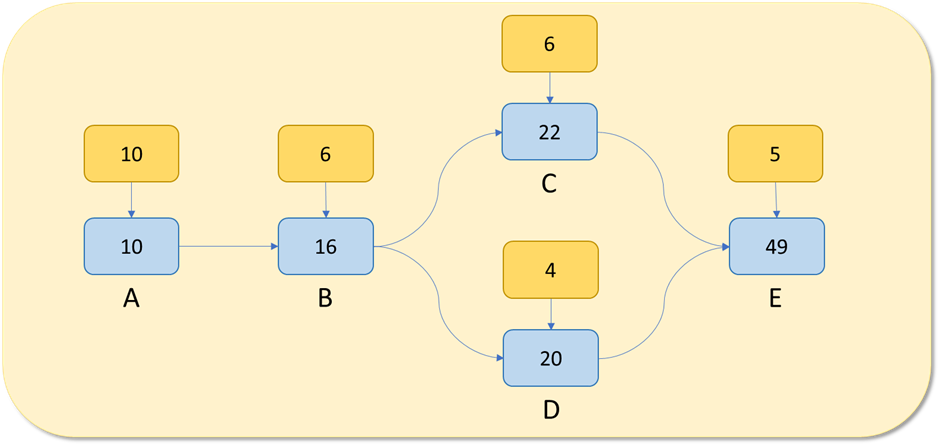
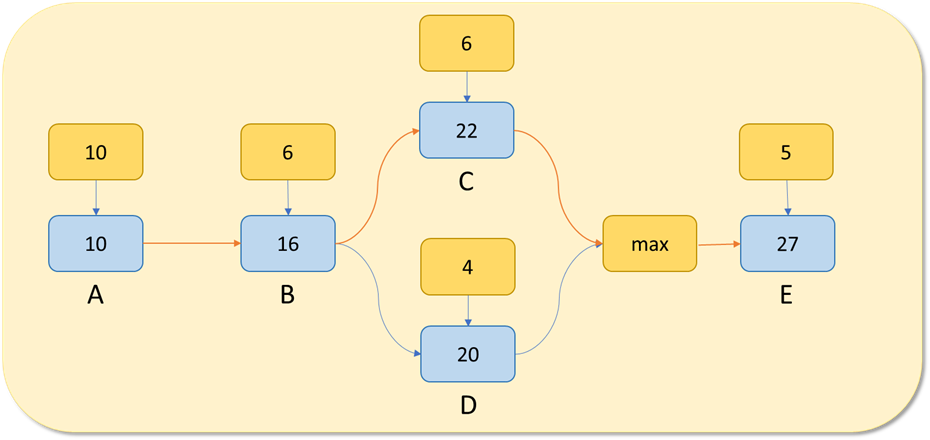
Our goal was to calculate the minimal development time of application A till E. The outcome 49 shown in application E is not correct. We should have calculated the minimal development time as the maximum of 22 and 20 and add the build time of application E to it: max (22,20) + 5 = 27. We correct this error by adding a Max-operator to our canvas like below. Note that the so-called critical path is highlighted red.
Note this example is extremely simple, but it should be clear how more advanced data manipulations, aggregations and analytics can be applied!
Conclusion
Adding dependencies, metrics and perspectives are very powerful concepts that let’s the user perform advanced analytics to landscapes. In this showcase we barely scratched the surface of the analytical possibilities! In one of the following showcases We’ll show other very common use-cases that make use of these concepts as well.
Back to News & Events